Introduction:
The Yangtze River has experienced a massive amount of dam building over the past sixty years. Of all the dams built on the river, none is as grandiose as the Three Gorges Dam. Without a doubt, the Three Gorges Dam in China is a feat of modern engineering. Spanning 1.3 miles, the dam was completed in 2006 and made operational in 2008. Before the dam was completed however, major environmental concerns relating to the dam's impact were raised. The reasons behind building the Three Gorges Dam are numerous, ranging from flood control to hydroelectric power production to increased navigation on the Yangtze River. Issues that weren't taken into account however, were increased erosion, deforestation and the displacement of millions of Chinese citizens. One of the biggest environmental issues with the Three Gorges Dam is the problem of sedimentation, both at the site of the dam and downstream. By stopping the Yangtze River, the carrying capacity of the water is decreased, therefore its ability to transport sediment decreases as well. As soon as the dam was completed, sediment buildup behind the dam began increasing. With the river depositing sediment behind the dam, once the water passes through, it is carrying much less sediment as the river moves downstream to the Shanghai delta.
Previous Studies:
Ever since the construction of the Three Gorges Dam, many studies have been conducted on its environmental impact. Studies have been conducted on deforestation, erosion and sedimentation changes. With regards to sedimentation, studies have been conducted downstream in order to see how downstream deposition affects the alluvial plains of the lower Yangtze River. All different types of satellite imagery, as well as on site data, have been used to study the site. MODIS sensor data, ASTER data, and Landsat imagery have been used to explore the changes in sedimentation at various sites along the Yangtze River. The biggest problem regarding these studies is that with the dam's construction being so recent, the environmental effects are hardly known and are constantly changing.
Problem Statement:
By damming the Yangtze River, the sediment load is deposited behind the Three Gorges Dam. Over time, this sediment build up will have major effects on the river, dam, and reservoir behind the dam. While the effects of sedimentation behind the Three Gorges Dam are relatively unknown, the possibilities for major impacts both at the site of the dam as well as downstream are great. For this project, I plan to study the changes in downstream sedimentation over the course of the Three Gorges Dam construction and in the time period before and after. The study site will be the discharge point of the Yangtze River into the Pacific Ocean in Shanghai.
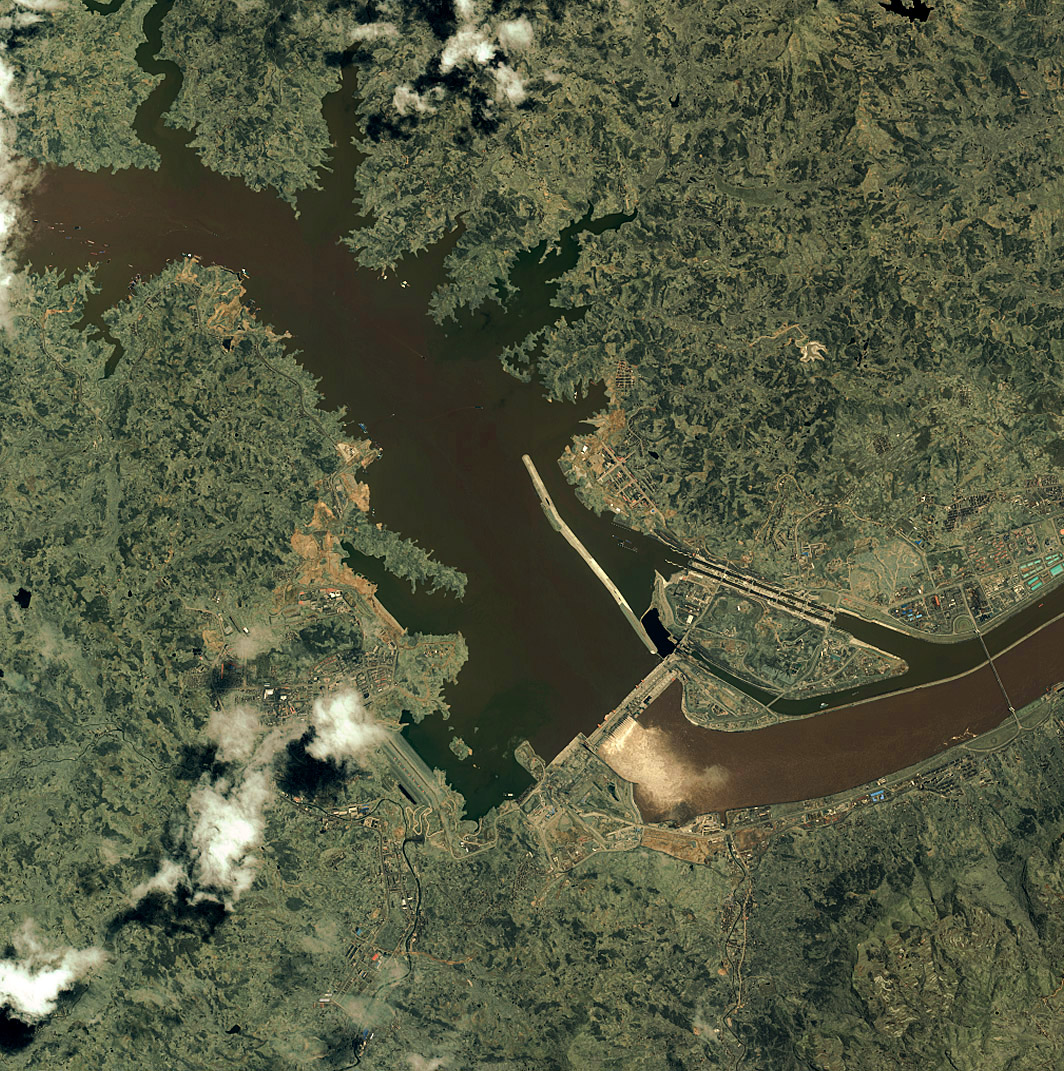
Above: NASA image of the Three Gorges Dam
Methodology:
Sediment Deposition in Shanghai
A major environmental problem associated with the Three Gorges Dam is the changes in downstream sedimentation. In order to test the effects of this, satellite imagery of the discharge point of the Yangtze River is needed. The main imagery being used will be supplied by the Landsat 4, 5, and 7 satellites, which are equipped with the Thematic Mapper and Enhanced Thematic Mapper sensors. With these images, the blue (band 1) and near-IR (band 4) bands will be used. These bands provide a detailed look through the water to identify suspended sediments. From here, an NDVI function will be used to identify sediment in the water, followed by a density slice classification to color the images. Lastly, change detection swill be used between different images to notice the changes. While the study will lack in situ data collected from Secchi disks and nephelometric turbidity units (NTUs), the spectral and IR data analysis will still provide information on sediment prevalence in the river water, and can therefore be used to identify the changes in sedimentation in Shanghai where the Yangtze River meets the Pacific Ocean.
Creating a Sediment Index
Since this project is testing sediment instead of greenness, the use of an NDVI needs to be altered. With a standard NDVI, the red (band 3) and near-IR (band 4) bands are used, which allow for measurements of greenness. By using the blue and near-IR bands, sediment is being analyzed as opposed to greenness. In ENVI, after creating and RGB image using the order of band 1-band 4-band 1, allows for the creation of an NDSSI (Normalized Difference Suspended Sediment Index), which can then be colored to show different concentrations of sediment. With a standard NDVI, values come out between -1 and +1 with values closer to +1 indicating more greenness, while values closer to -1 illustrate areas that are less green. With the NDSSI, values below 0 usually indicate land. Values closer to +1 illustrate clear water, while lower values illustrate sediment laden and turbid water.
Standardized NDSSI Values
In order to accurately compare different images from different dates, a standardized NDSSI value chart was created. In this standardized list, the NDSSI values range from 0.1 to 1, with the higher values representing clearer water. The color scheme used goes from orange to yellow to blue.
Results:
In order to set a baseline, the first image used was take by Landsat 5 using its onboard Thematic Mapper sensor. The images were taken on May 18th, 1987 of the Yangtze River delta. At this time, there had been no construction on the Three Gorges Dam.

Above: Spectral Image of the Yangtze River Delta (May 18th, 1987)
The spectral image above was created using bands 3, 2, and 1. From here, the bands were reorganized like so: band 1, band 4, band 1 to create an infrared image to identify sediment in the water.

Above: Bands 1-4-1 identifying sediment
As discussed above, by ordering the bands in a 1-4-1 succession as opposed 4-3-4 for standard NDVIs, an NDSSI can be created for the suspended sediment.

Above: NDSSI of the Yangtze River Delta. May 18th, 1987
Lastly, the NDSSI image was color coded using the density slice feature on ENVI. The standardized density slice numbers used above were utilized for the coloring of the image.

Above: Colored NDSSI Image
From here, three more dates were selected and the same processes used above were applied to the images.
The next testing date used was October 31st, 1995. This image was take with the Landsat 5 satellite and utilized the onboard Thematic Mapper sensor. This date was right after construction on the dam began.

Above: Spectral image of the Yangtze River Delta. October 31st, 1995

Above: Bands 1-4-1 identifying sediment

Above: NDSSI image of the Yangtze River Delta

Above: Colored NDSSI Image
The next test date was August 15th, 2005. The image was take using the Landsat 7 satellite with the onboard Enhanced Thematic Mapper sensor. By this time, the majority of construction had been completed on the dam body.

Above: Spectral Image of the Yangtze River Delta. August 15th, 2005

Above: Bands 1-4-1 identifying sediment

Above: NDSSI Image of the Yangtze River Delta

Above: Colored NDSSI Image
The final test date used was April 26th, 2011. The image was take with the Landsat 7 satellite with the Enhance Thematic Mapper sensor. By this date, construction on the Three Gorges Dam had been completed and the dam was operational.

Above: Spectral Image of the Yangtze River Delta. April 26th, 2011

Above: Bands 1-4-1 identifying sediment

Above: NDSSI of the Yangtze River Delta

Above: Colored NDSSI Image
Change Detections:
This final step in analyzing the images above was to use the change detection function in ENVI to see how sediment values have changed over time in the Yangtze River delta. The change detections below show how over the past twenty years sedimentation in the Yangtze River Delta has experienced some drastic changes. In a change detection between two NDVI images, the presence of red represents an increase in greenness (where the NDVI values move closer to +1) and blue represents a decrease in greenness (where values move closer to zero). When applied to the NDSSI index used in this study, red (representing an increase towards the value +1) illustrates areas where there was increased clarity in the water. Blue on the other hand represents a decrease in clarity and therefore an increase in sediment load.

Above: Change detection between May 18th, 1987 and October 31st, 1995.

Above: Change Detection between October 31st, 1995 and April 26th, 2011
Discussion of Results
The change detections above show just how drastic the changes in sedimentation in the Yangtze River Delta have been over the past twenty years. Prior to the building of the Three Gorges Dam, the sediment levels in the Yangtze River were very high. The change detection between 1987 and 1995 shows an increase in sediment load in the river. After the completion of the dam, the sediment load in the river dropped off drastically. The change detection shows how the sediment load has lowered. Granted, the Three Gorges Dam isn't the only reason for this drop off; however, it is definitely a large factor. Even comparing the spectral images shows how drastic the drop off in sediment downstream in Shanghai has been. The images from 2011 show clear water throughout the entire river, as do the NDSSI images. Every image prior to this shows heavy sediment loads in the river.
While the Three Gorges Dam is a factor in the decrease in sediment load downstream, there are lots of other variables to take into consideration. One of these is the number of dams on the river downstream of the Three Gorges Dam, since every single one of these would have an effect on sedimentation. The biggest outside factor affecting sedimentation however is the weather in the region. Periods of high rain greatly affect sediment loads in rivers. Images from the rainy season show higher sediment concentrations when compared to images from the dry season.
Another issue that came up in the study was the use of the standardized sediment index. In some cases, the spectral images show dark sediment that isn't reflected in the NDSSI image. Furthermore, it appears that deep water has NDSSI values similar so sediment. In the images from 2005, the far eastern portion is clearly deep blue ocean water; however, it appears orange in the colored NDSSI image. This is a problem that occurs in other images as well. Similarly, the standardized index in the 1995 image produces gray sections in the northern portion of the river. The reasons for this are numerous, ranging from image quality to increased reflectance and scattering by the sediment in the water.
If I were to continue this study, the most important component that was missing was on site data collected from Secchi disks or NTUs. This would allow for correcting the scattering and absorption problems presented by the satellite imagery. Secondly, the lack of images (whether they were unavailable or had cloud cover that rendered them unusable) played a role because it was difficult to analyze images from the same months in the climatic seasons. With the addition of on site data and a better image bank, I feel that this project could show much more detail with the results.
Overall however, it is obvious that there has been a decrease in the sediment load in the Yangtze River Delta. Spectral images as well as infrared and NDSSI images all prove this phenomenon. The long term effects of this are numerous and largely unknown. Since the Three Gorges Dam was completed less than five years ago, the environmental impacts of the project are still making themselves apparent. It is reasonable to assume that with continued damming of the Yangtze River with projects like the Three Gorges Dam, the sediment load downstream where the Yangtze River meets the Pacific Ocean will continue to decrease.
Author
Matthew J. Flesock
UCLA Class of 2012
Major: Geography/Environmental Studies and History
Author
Matthew J. Flesock
UCLA Class of 2012
Major: Geography/Environmental Studies and History
Works Cited
Hu, B.Q., "Sedimentation in the Three Gorges Dam and its impact on the sediment flux from the Changjiang (Yangtze River), China." http://www.hydrol-earth-syst-sci-discuss.net/6/5177/2009/hessd-6-5177-2009.pdf
Jenson, John. Remote Sensing of the Environment: An Earth Resource Perspective. 2nd edition. Pearson Education: Upper Saddle River, New Jersey. 2007.
Xu, Kenhui and John Milliman. "Seasonal Variations of Sediment Discharge from the Yangtze River Before and After Impoundment of the Three Gorges Dam." http://ww2.coastal.edu/kxu/Geomorphology09.pdf
Xu, Kenhui and John Milliman. "Yangtze Sediment Decline Partly From the Three Gorges Dam." http://ww2.coastal.edu/kxu/EOS06.pdf.